
Charts & InfographicsGPT Image 2Web InterfaceSatellite ImageryTechnical UIModernUI MockupData Visualization
Mockup giao diện web theo dõi dị thường vệ tinh
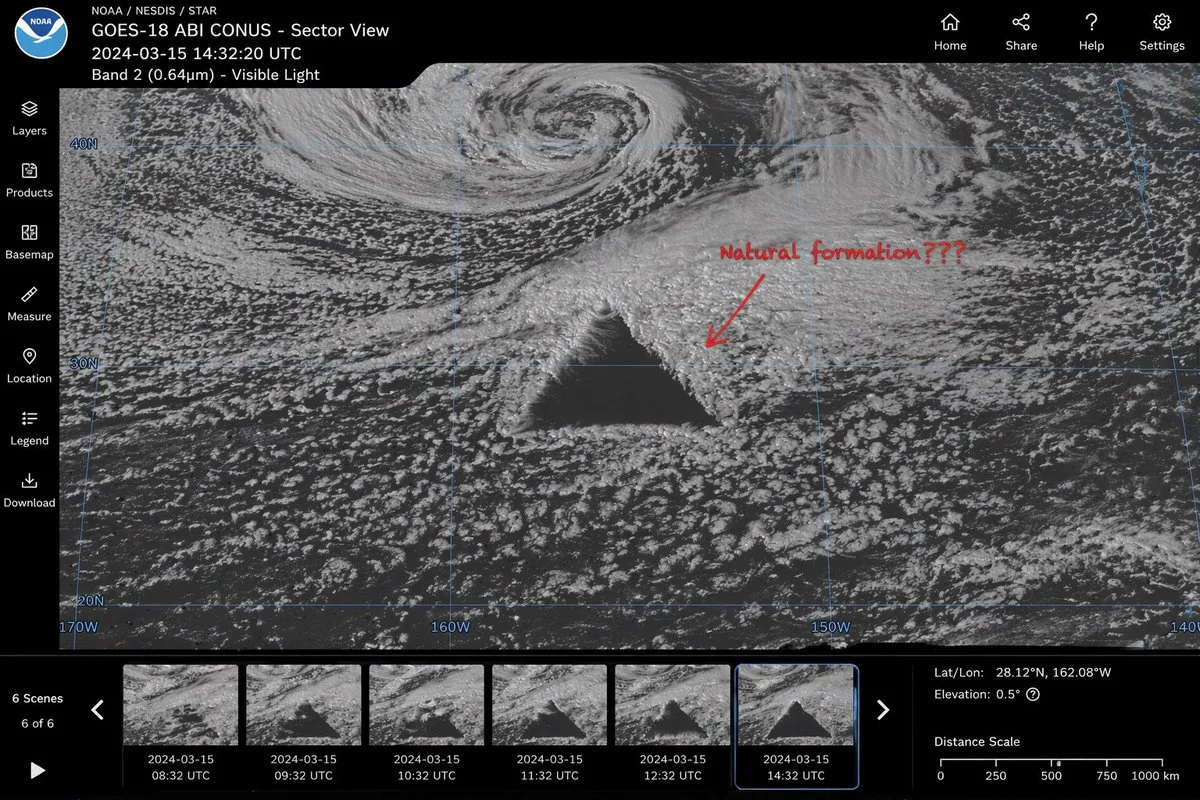
Mockup giao diện web theo dõi và phân tích hình ảnh vệ tinh, hiển thị phát hiện điểm dị thường trên đại dương kèm các thanh điều hướng, dòng thời gian và bảng thông số tọa độ.
Bản tiếng Anh
{
  "type": "satellite imagery web interface mockup",
  "main_display": {
    "imagery": "greyscale satellite view of ocean clouds featuring a {argument name="anomaly shape" default="massive, perfectly geometric dark triangle"} in the center",
    "annotation": "red handwritten text '{argument name="annotation text" default="Natural formation???"}' with a red arrow pointing to the anomaly",
    "overlay": "faint blue latitude and longitude grid lines with coordinate labels like 40N, 30N, 160W"
  },
  "ui_layout": {
    "top_header": {
      "left_section": "NOAA logo, text '{argument name="satellite name" default="GOES-18 ABI CONUS - Sector View"}', '{argument name="timestamp" default="2024-03-15 14:32:20 UTC"}', and 'Band 2 (0.64µm) - Visible Light'",
      "right_section": "4 navigation icons with labels: Home, Share, Help, Settings"
    },
    "left_sidebar": {
      "count": 7,
      "items": ["Layers", "Products", "Basemap", "Measure", "Location", "Legend", "Download"]
    },
    "bottom_panel": {
      "timeline": {
        "controls": "Play button, left/right arrows, text '6 Scenes', '6 of 6'",
        "thumbnails": {
          "count": 6,
          "description": "sequential satellite images showing the anomaly's progression, with hourly timestamps from 08:32 UTC to 14:32 UTC"
        }
      },
      "data_readout": {
        "coordinates": "{argument name="coordinate text" default="Lat/Lon: 28.12°N, 162.08°W"}",
        "elevation": "Elevation: 0.5°",
        "scale": "Distance Scale bar from 0 to 1000 km"
      }
    }
  }
}
Bản tiếng Việt
{
  "type": "mockup giao diện web ảnh vệ tinh",
  "main_display": {
    "imagery": "hình ảnh vệ tinh thang độ xám chụp các đám mây trên đại dương với một {argument name="anomaly shape" default="massive, perfectly geometric dark triangle"} ở trung tâm",
    "annotation": "chữ viết tay màu đỏ '{argument name="annotation text" default="Natural formation???"}' kèm mũi tên màu đỏ chỉ vào điểm dị thường",
    "overlay": "các đường lưới vĩ độ và kinh độ màu xanh lam mờ với các nhãn tọa độ như 40N, 30N, 160W"
  },
  "ui_layout": {
    "top_header": {
      "left_section": "logo NOAA, chữ '{argument name="satellite name" default="GOES-18 ABI CONUS - Sector View"}', '{argument name="timestamp" default="2024-03-15 14:32:20 UTC"}', và 'Band 2 (0.64µm) - Visible Light'",
      "right_section": "4 biểu tượng điều hướng kèm các nhãn: Home, Share, Help, Settings"
    },
    "left_sidebar": {
      "count": 7,
      "items": ["Layers", "Products", "Basemap", "Measure", "Location", "Legend", "Download"]
    },
    "bottom_panel": {
      "timeline": {
        "controls": "Nút Play, các mũi tên trái/phải, chữ '6 Scenes', '6 of 6'",
        "thumbnails": {
          "count": 6,
          "description": "các hình ảnh vệ tinh tuần tự thể hiện diễn biến của điểm dị thường, với các mốc thời gian theo từng giờ từ 08:32 UTC đến 14:32 UTC"
        }
      },
      "data_readout": {
        "coordinates": "{argument name="coordinate text" default="Lat/Lon: 28.12°N, 162.08°W"}",
        "elevation": "Elevation: 0.5°",
        "scale": "Thanh tỷ lệ khoảng cách từ 0 đến 1000 km"
      }
    }
  }
}
Mẹo sử dụng
Tùy chỉnh linh hoạt các trường dữ liệu JSON như tọa độ, mốc thời gian, loại cảm biến vệ tinh hoặc nội dung chú thích để phù hợp với dự án thiết kế UI hệ thống giám sát không gian địa lý.
Nguồn và quyền sử dụng
- Nguồn
- https://x.com/MullerScot19970/status/2044613172641108240#reversed-0
- Tác giả gốc
- Scott Muller
- License prompt
- CC-BY-4.0
- License ảnh
- CC-BY-4.0