
Charts & InfographicsGPT Image 2InfographicData VisualizationAcademicLine Graph
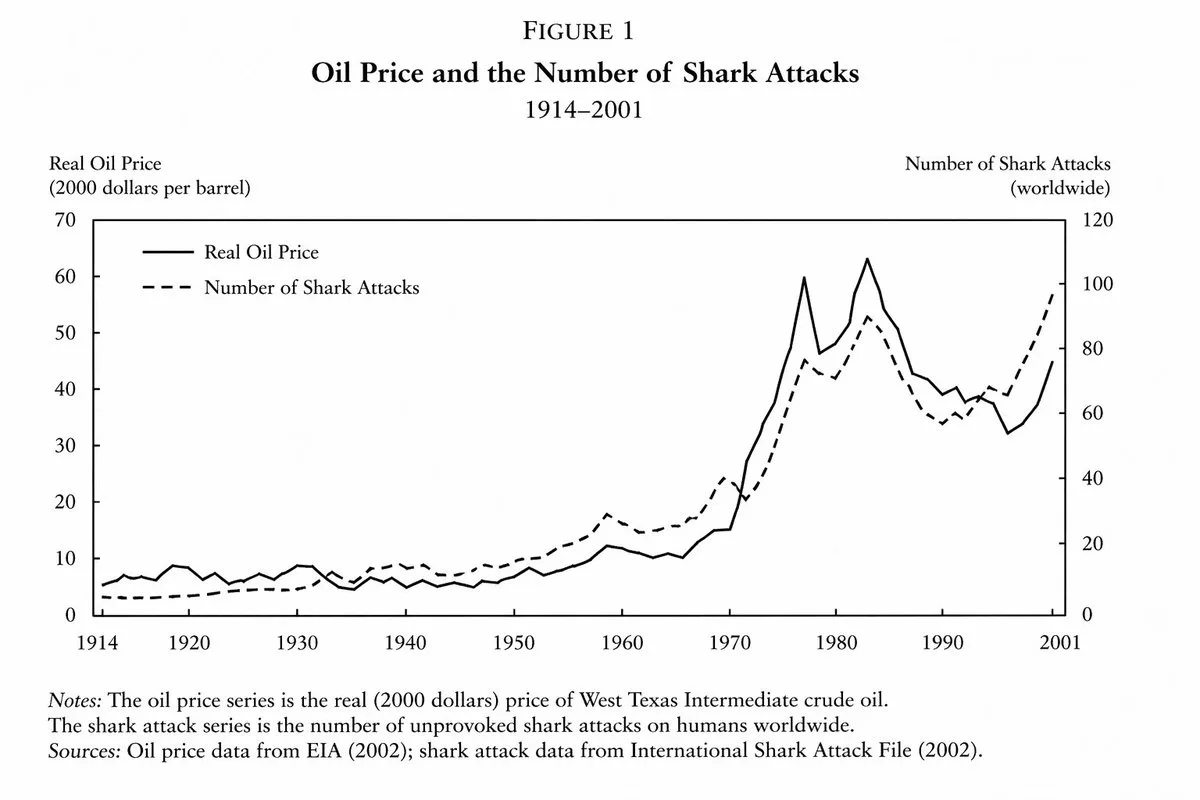
Mô phỏng biểu đồ kinh tế học thuật
Prompt dùng để tạo biểu đồ đường theo phong cách học thuật từ một ấn phẩm uy tín, minh họa mối quan hệ tương quan chặt chẽ giữa hai yếu tố theo thời gian.
Bản tiếng Anh
line graph from an important and prestigious {argument name="field" default="economics paper"} demonstrating a close but not exact relationship between {argument name="variable one" default="the price of oil"} and {argument name="variable two" default="the number of shark attacks"} between {argument name="time period" default="the years of 1914 and 2001"}Bản tiếng Việt
biểu đồ đường từ một {argument name="field" default="economics paper"} quan trọng và uy tín thể hiện mối quan hệ chặt chẽ nhưng không hoàn toàn chính xác giữa {argument name="variable one" default="the price of oil"} và {argument name="variable two" default="the number of shark attacks"} trong khoảng giữa {argument name="time period" default="the years of 1914 and 2001"}Mẹo sử dụng
Điền tên ấn phẩm nghiên cứu vào biến đầu tiên, hai chỉ số kinh tế cần so sánh vào hai vị trí tiếp theo, và mốc thời gian khảo sát vào biến cuối cùng để tạo biểu đồ trực quan và chân thực.
Nguồn và quyền sử dụng
- Nguồn
- https://x.com/QiaochuYuan/status/2046734593374781951
- Tác giả gốc
- QC
- License prompt
- CC-BY-4.0
- License ảnh
- CC-BY-4.0